Simplify your rental cash flow analyzing and reporting
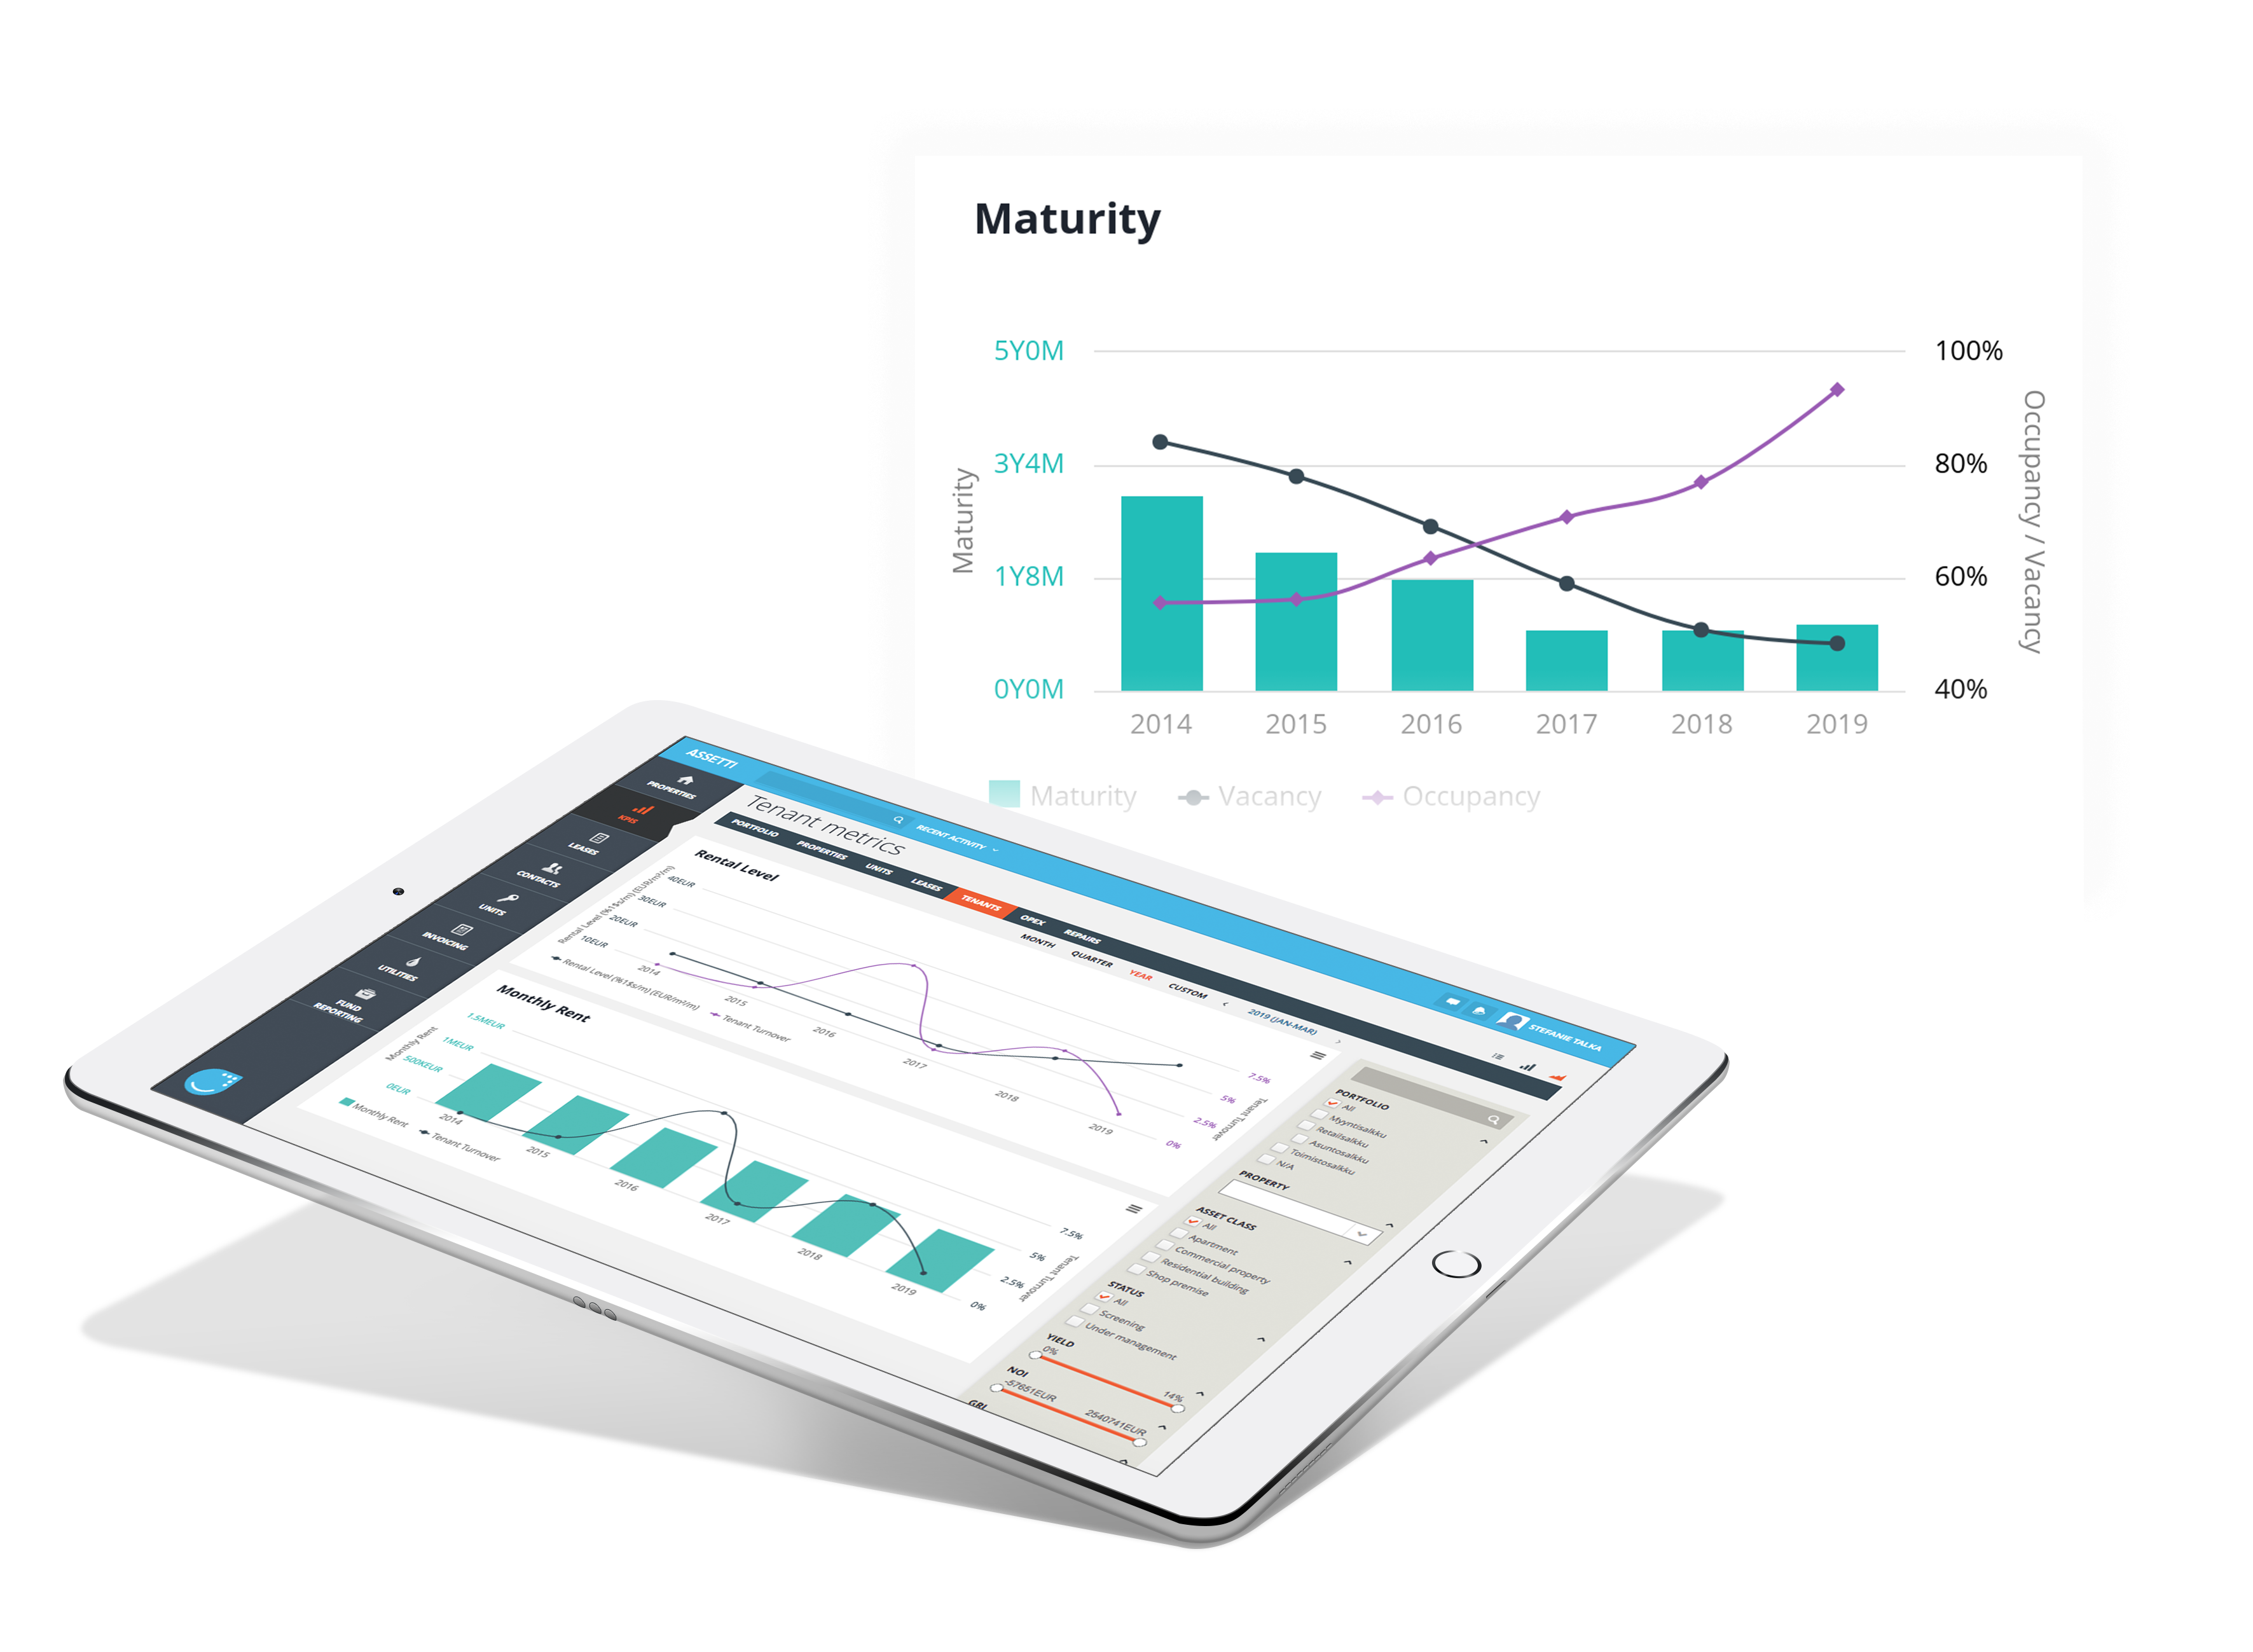
Over 40 different KPIs about your lease agreements and rent rolls are provided to you in visualized forms in Assetti. You can filter, report and visualize your important KPIs whenever you want. With our dashboards and table information, Assetti ensures that your occupancy, maturity and rental level information is always at your fingertips.
Optimize costs and improve your tenant relationship
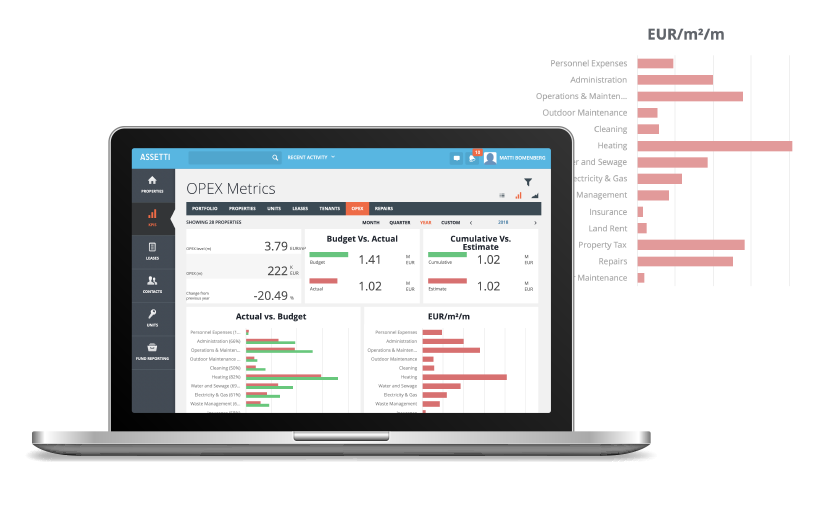
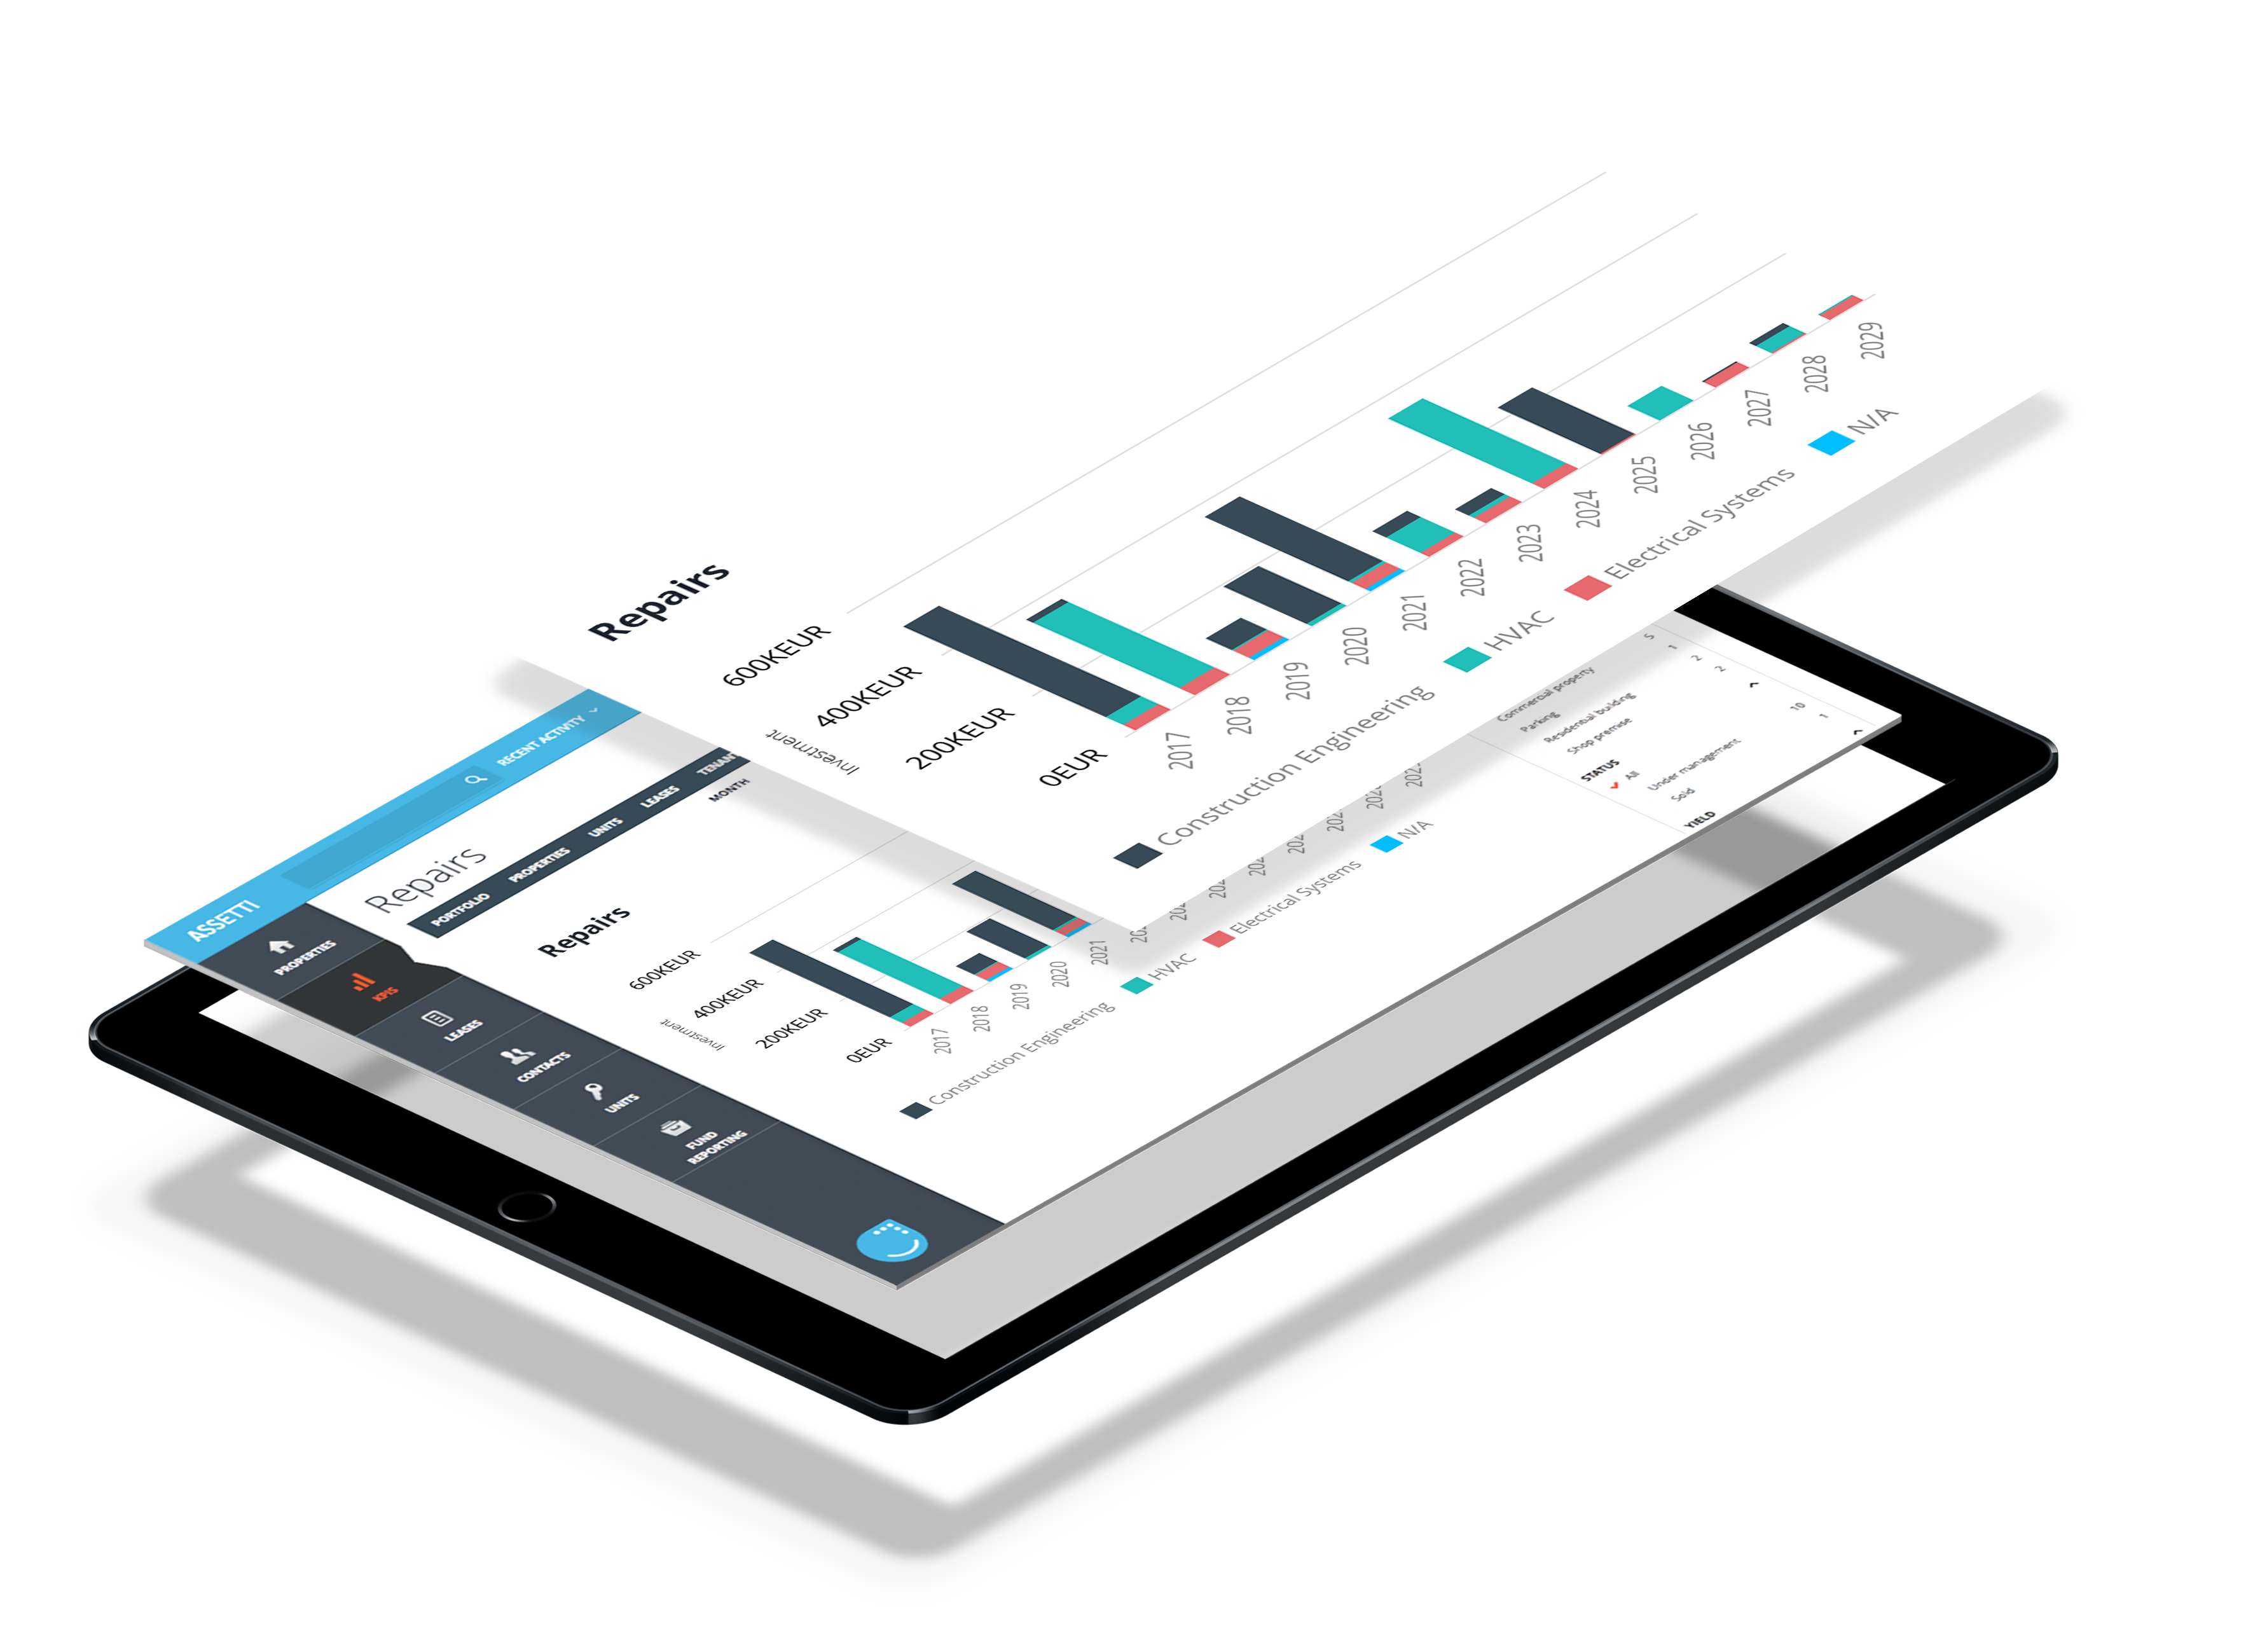
Visualize your operating expenses, repairs, and net operating income KPIs as beautiful dashboards. Visual representations of your OPEX information makes it easy to improve tenant relationship and optimize costs. You can filter and export any necessary data for further use.
Identify investment needs and critical repairs quickly
Managing repairs and investment types is easier than before. You can identify investments and repairs for the same geographical area, portfolio or individual property asset based on the visualized KPIs. This fastens your reporting and daily work.
Property asset's financial performance at your fingertips
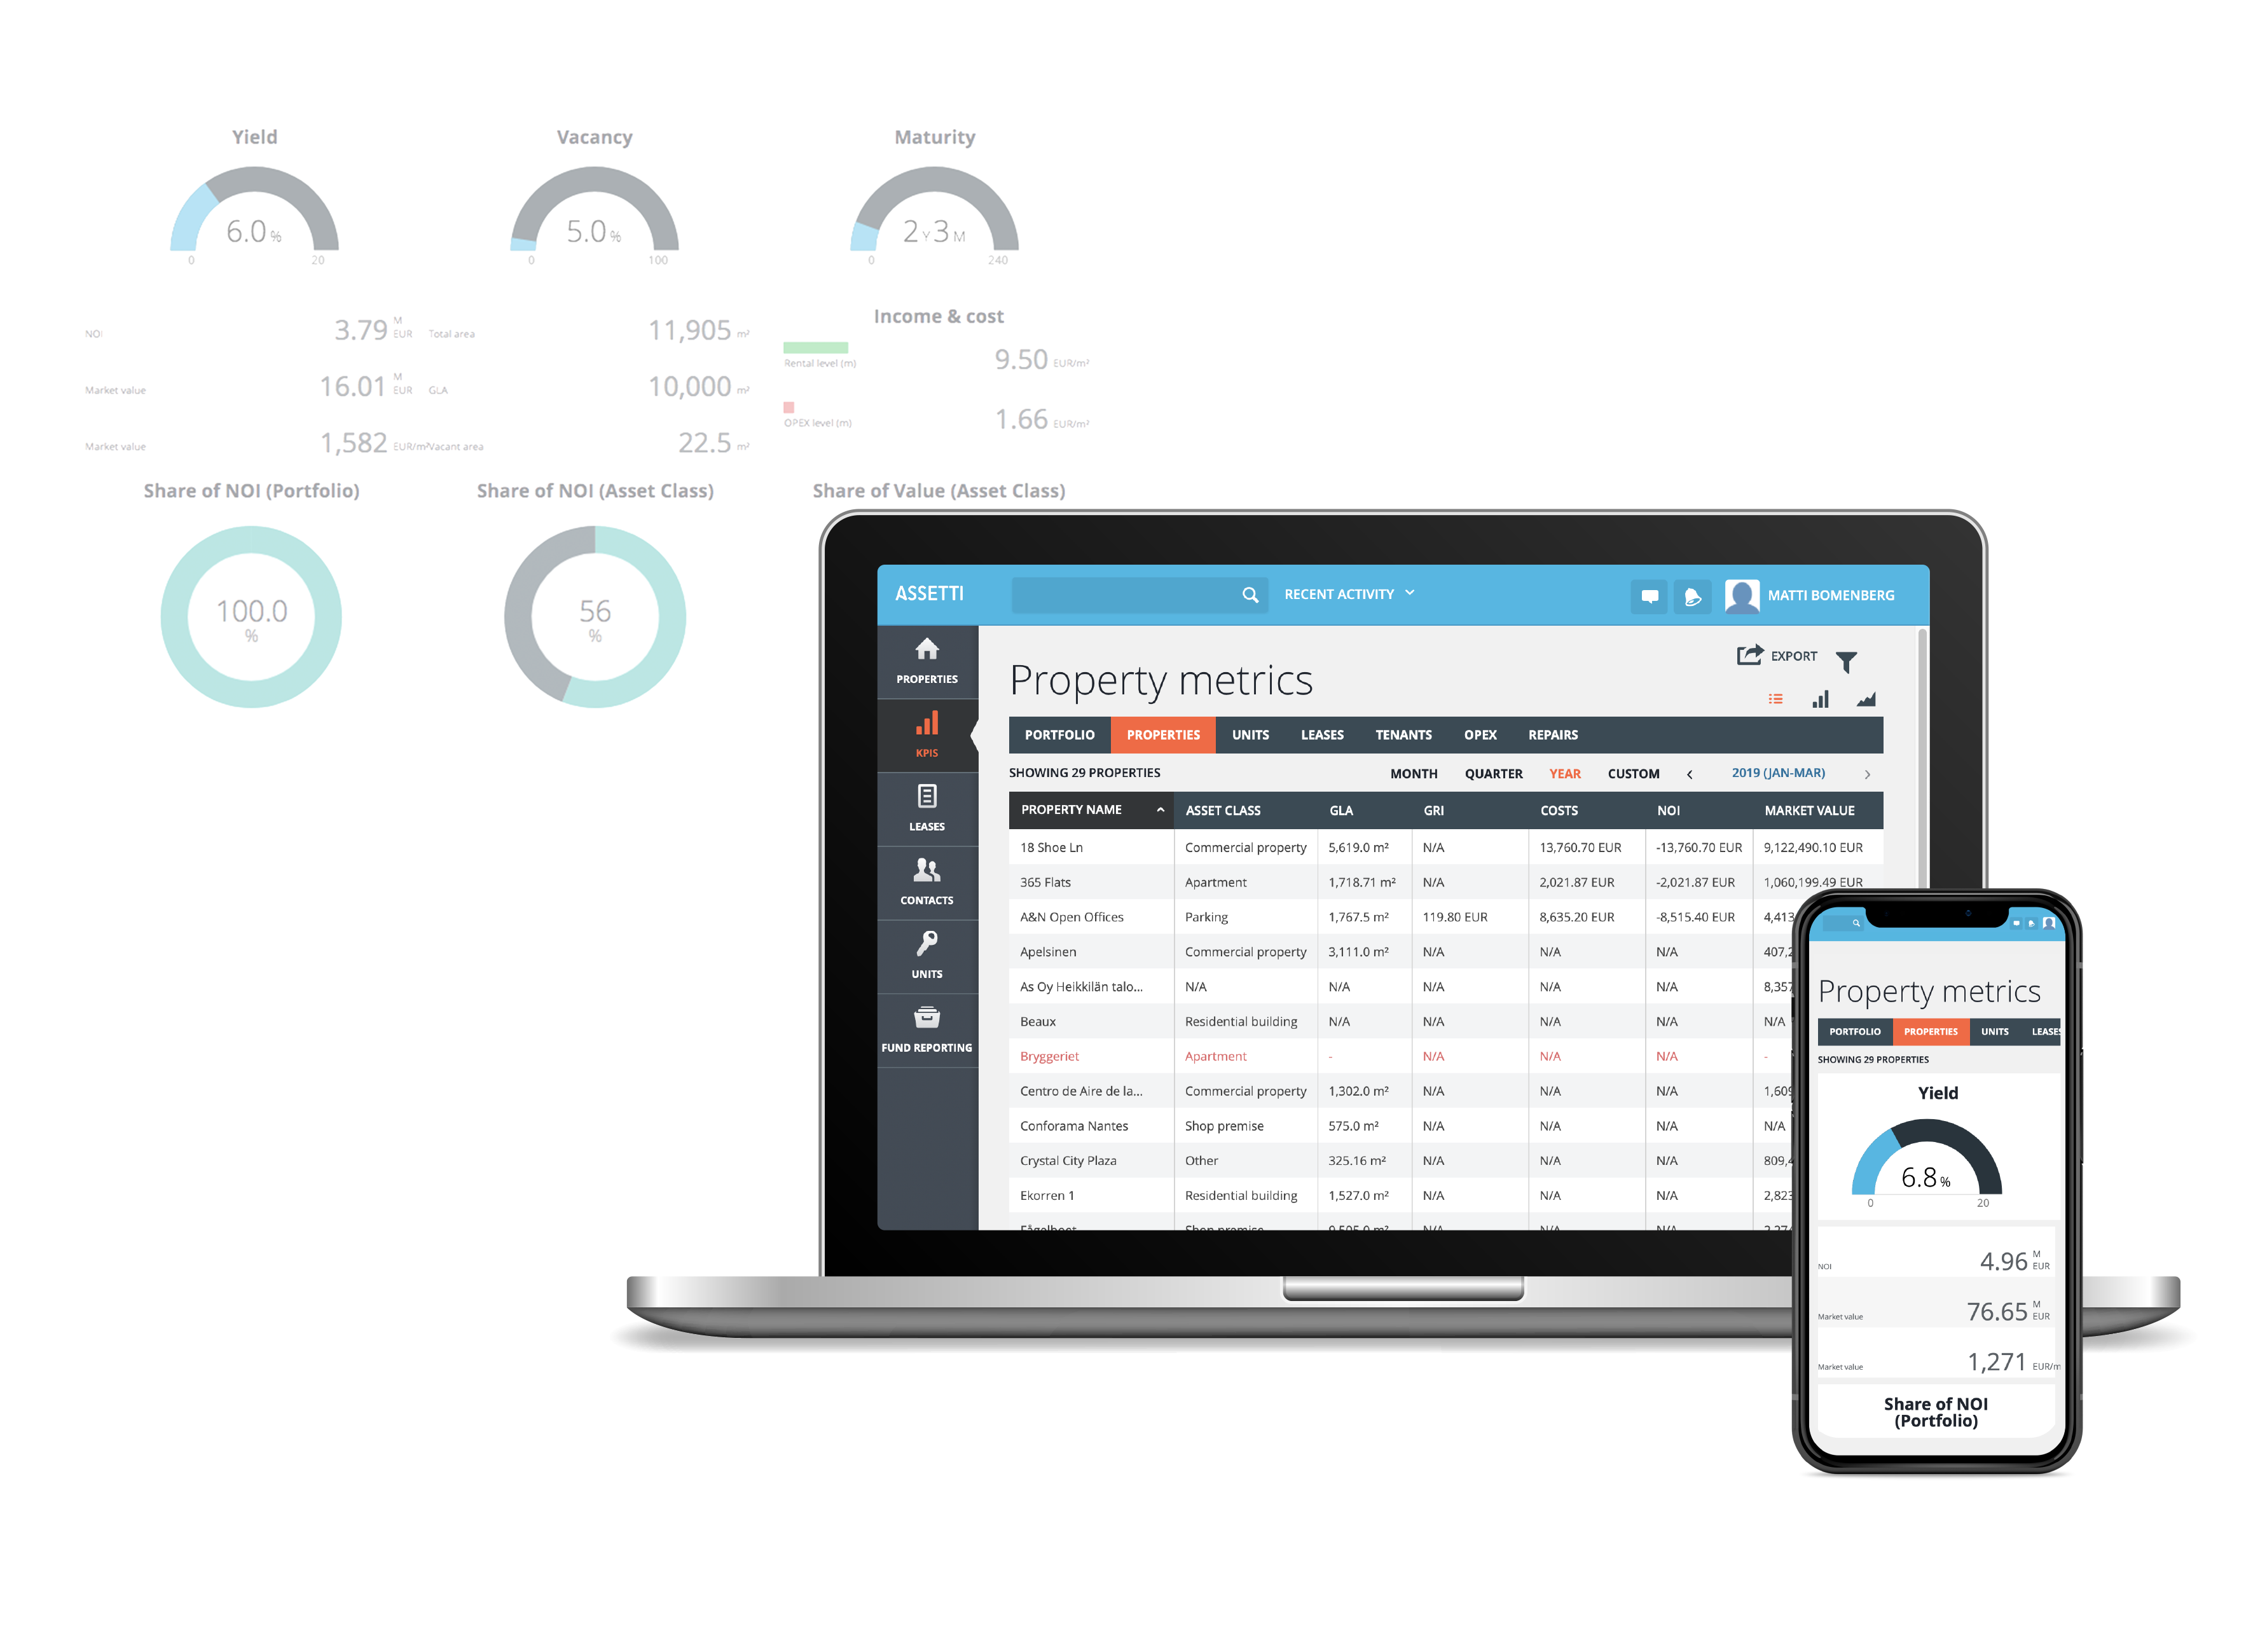
Know the financial performance of your assets at a glance with Assetti's visual dashboards. Communicate with your stakeholders and get the necessary information about your net operating income and yield in the same application. With real-time data, you can make accurate decisions quickly.
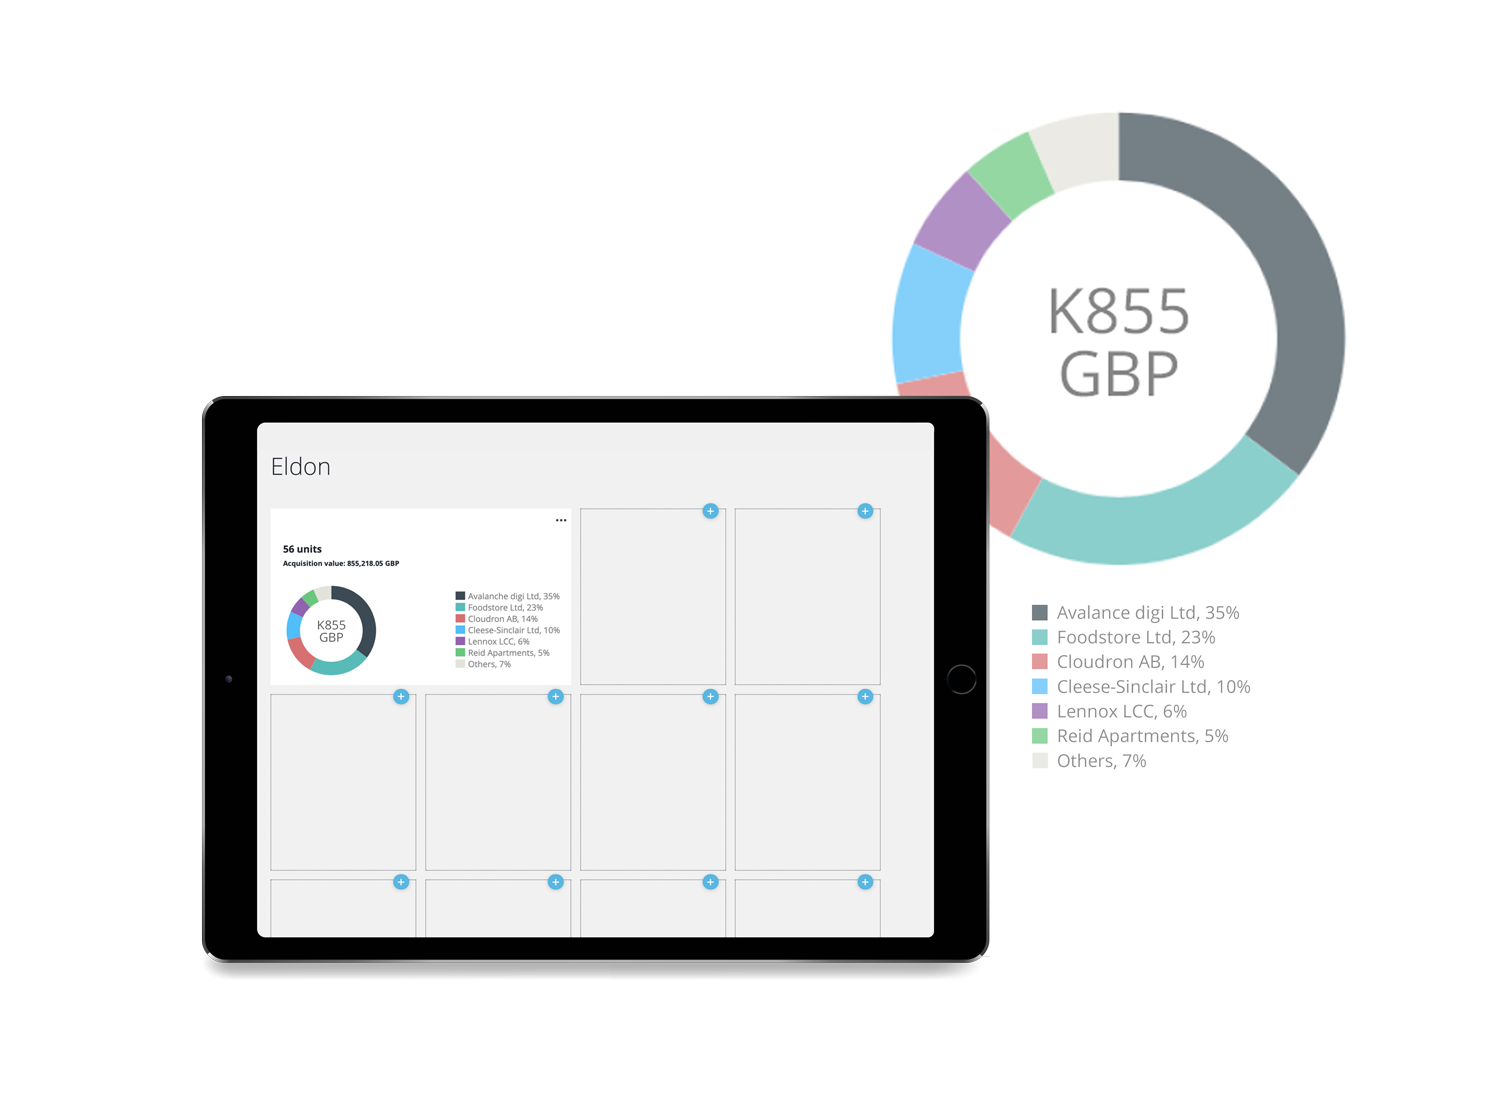
Customized multifund reporting and visualization
Manage your multiple funds efficiently with Assetti's customizable widget-based fund reporting. Adjust or replace different KPIs, provide written market analyzes and summaries of your fund's performance. Choose those KPIs you or your team needs, and share them internally or externally.
